Since version 1.5 the Oracle SQL Developer has the capability to view and analyze raw trace files in an interactive way. In this blog post, I will demonstrate how to use this very unknown feature.
Open Trace File
To analyze a trace file, download it from the database server to the client where Oracle SQL Developer is running. Afterward, start Oracle SQL Developer and open the trace file using File > Open or drag and drop the trace file directly into the Oracle SQL Developer window. In my example, I will analyze the trace file hr_selects.trc.
A new tab is opened for the trace file. It provides four different sub tabs.
- Tree View
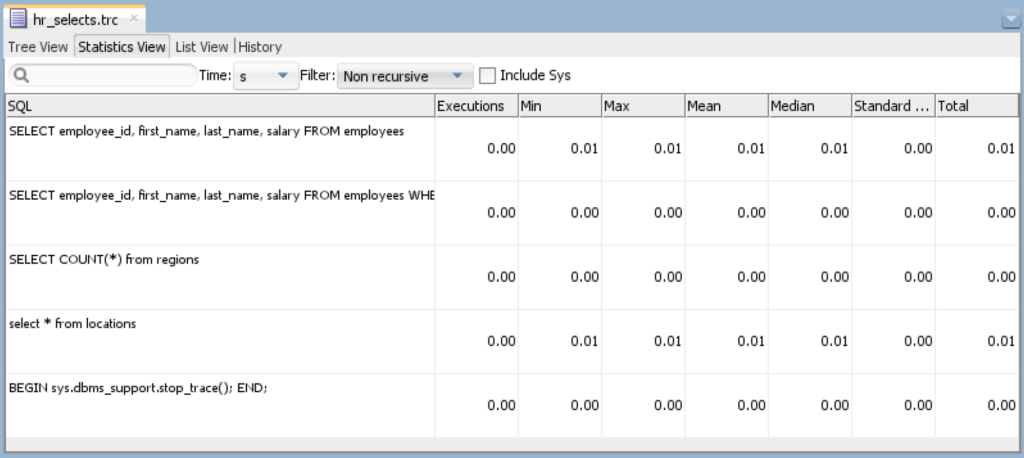
- Statistics View
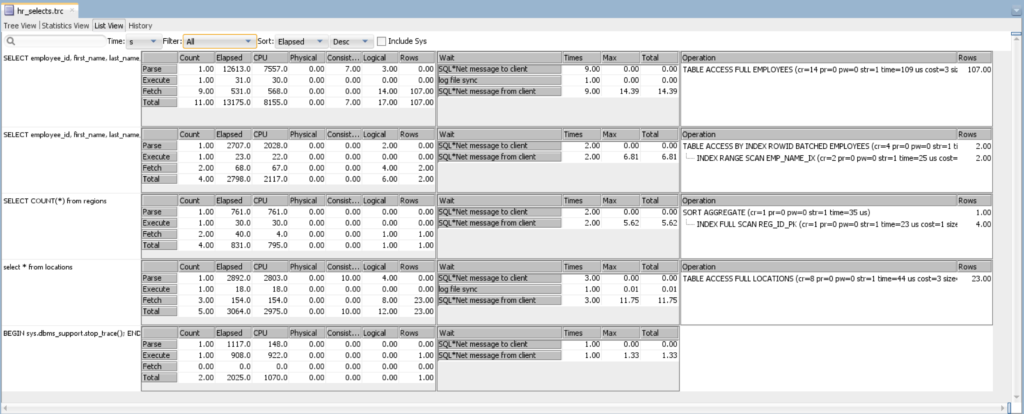
- List View
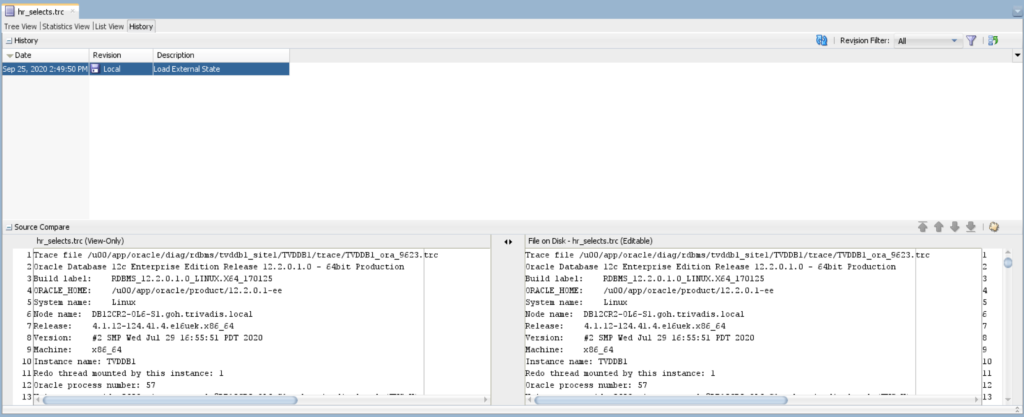
- History
Most of the tabs provide interactive filter and sort options. For example you can search the trace file for specific SQL statements or sort the executed SQL statements by its elapsed time or used CPU.
Tree View
This tab shows an overview of the executed SQL statements in chronological order. No further information is provided.

Statistics View
This view provides a quick overview of the runtimes of each executed statement. Per default, internal SQL statements are excluded (select Include Sys if you want to see them).

List View
This view includes the most information for each statement. To see all statements change the filter from Recursive to All. If the trace file includes wait events and execution plan details, they are shown in the view as well.

History
This tab provides access to the contents of the trace files. It is also possible to manipulate the trace file.

Summary
Compared with the command line tool tkprof, analyzing a trace file using Oracle SQL Developer is much more convenient. It allows quick filtering and sorting of the content without the need to analyze the file again.
More information about thie feature can be found in the Oracle SQL Developer User’s Guide.
